EmbryoGENE Profiler |
Search | Help | Methods | References | Cite
Expression profiles by tissue
Searching
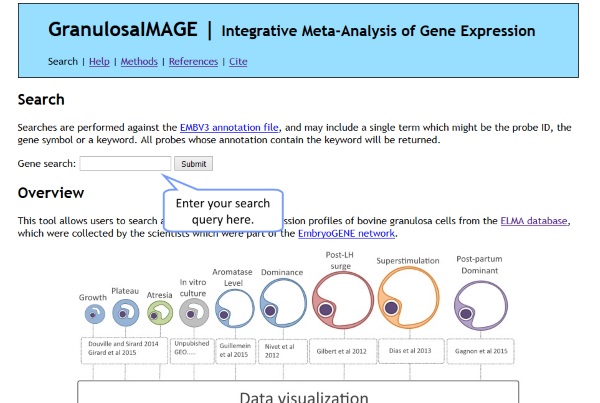
Searching tissue expression profiles within IMAGE is very simple: just go to the home page, and enter your query in the appropriate search box. You can search for EMBV3 probe ids, gene symbols, gene names, or individual words which might appear in a gene's description. If you type in a phrase, it will be searched for in full.
Overview of the results page
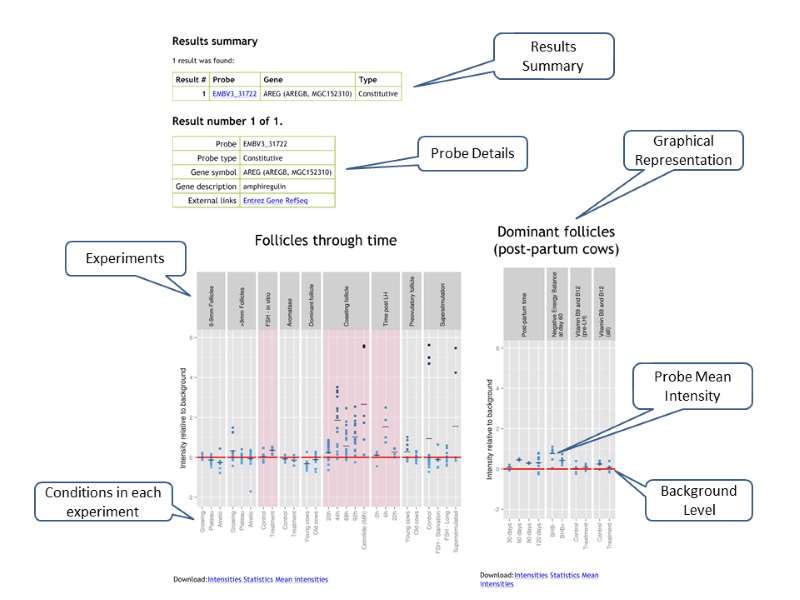
Once a query is entered, IMAGE will display the profiles of all EMBV3 probes which matched the query. A summary of all matchings probes is provided at the top of the page. All profiles are then displayed below.
Individual probe profiles
The provided profiles are meant to give an overview of the conditions in which a gene is expressed and, conversely, the conditions in which it is not. Each probe has its own profile, and all profiles have this general appearance:
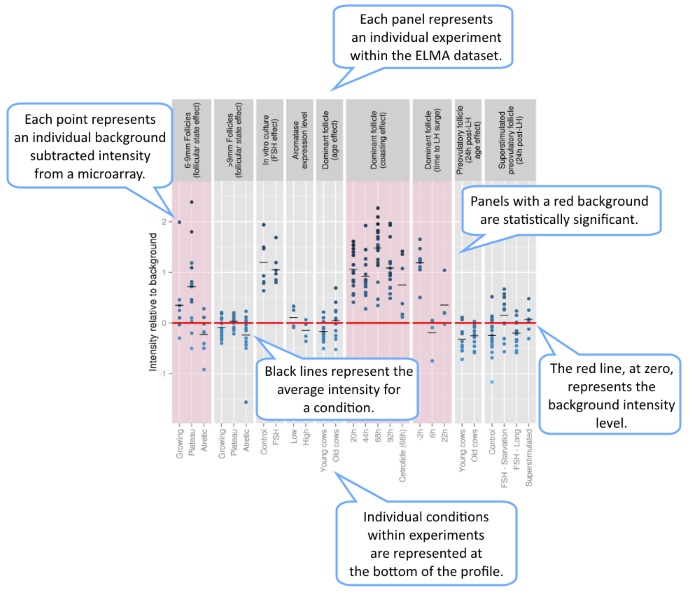
Each panel represents a particular experiment, with each column of points representing a particular condition within that experiment. Conditions with the same name (such as control/treatment) across groups do not represent the same samples.
The y-axis represents the base 2 logarithm of the raw measured intensity of the probe subtracted by its array overall background detection threshold. Thus, a value of 1 means that the probe had twice as much signal as the background and a value of -1 means that the probe has only half as much signal as the background. The small horizontal lines for each condition represent the mean background-relative intensity for this condition.
The red line, at 0, represents the background level itself. The background threshold for each array is an estimated upper bound of the negative array controls. Thus many probes, negative control or not, have intensities below the background threshold. In general, the genes represented by such probes can be considered to be "not expressed".
Panels with a significant difference are highlighted in red. These indicate that an ad hoc statistical test on the given group was significant at the 0.05 level. For groups with two conditions, this is a t-test. For groups with three or more conditions, this is a fixed-effect ANOVA.
Finally, all points are on a color-scale based on their normalized intensity, irrespective of the background levels of their array.
All statistical tests are ad hoc and do not take into consideration array effects, dye effects, technical replicates or secondary experimental factors, such as the individual cows from which samples are derived. Please refer to the reference articles for each of the categories for published, peer-reviewed statistical analyses where the above effects were considered.
Time courses of early development
Searching
To obtain the expression profiles of a family of genes throughout a time-course of bovine early development, simply enter your search term within the appropriate search box on the IMAGE home page. You can search for gene symbols, gene names, or individual words which might appear in a gene's description. If you type in a phrase, it will be searched for in full.
Overview of results
IMAGE will look through the full transcriptome annotation and identify all probes matching the search criteria. It will then extract those annotations, summarize them, and make them available for download.
All expression levels are measured in FPKM, or Fragments Per Kilobase of Exon per Million, to account for transcript length and library depth. To determine the expression levels of a family of transcripts, all FPKM are added together. IMAGE will produce two graphs representing the combined expression of all the selected transcripts.
- The first graph represents absolute expression levels. This is indicative of total RNA content, and all represented stages are on the same scale. If stage A has a combined expression of 1 and stage B has a combined expression of 2, then one would expect to find twice as many RNA molecules of the selected transcripts in stage B than in stage A.
- The second graph represents relative expression level, or the proportion of all transcripts expressed at this stage which falls within the selected family of transcripts. In the above example, if stage A had a total expression level of 10 while stage B had a total expression level of 20, then they would both be represented in the second graph as representing 10% of the total expression levels.